Last Updated: January 2026
Almost all SaaS companies need this budget vs. actual analysis to constantly monitor operational costs and align them with revenue targets. In the world of SaaS, there are many floating things at every stage of the business, and proper financial management can make the difference between growth and stagnation.
According to recent stats around 82% of small businesses fail to point to cash flow issues as a contributing factor. This highlights the need for accurate forecasting and other prophetical measures for an organization’s finances.
Variance analysis allows companies to better explain what is creating the delta between projections and reality. It also highlights areas where future positive results can be generated and spot positive and negative trends before they hit the bottom line.
In this article, we will explore how you can strategically use “budget vs. actual analysis” to grow your SaaS business.
Table of Contents
What is Budget Vs Actual Analysis
Why is It Good to Prepare a Budget Analysis and Examine Variances?
How to Analyze Budget vs. Actuals for a SaaS Company
Budget Vs Actual Analysis Example
Favorable and Unfavorable Variance
How to Use Variance Analysis to Drive Outcomes
Saufter.io – The Best AI-Powered Customer Engagement Platform
What is Budget Vs Actual Analysis
Budget vs. Actual analysis or variance analysis is a financial tool that compares budgeted financial numbers with the actual outcomes for a defined period. It is an analysis that helps in comparing the company’s actual performance with the expected performance based on the budget and identifying the deviations or the “variances”.
Compare actual results to budgeted results to some positive or negative variances. Then it is to be analyzed to understand the reason why the actual performance does not meet the budgeted target. The analysis of information can be used to calculate future decisions.
Key Elements of Budget vs. Actual Analysis
- Budgeted Figures: The intended level of revenue, expenses, and other financial measures expected at the beginning of a period.
- Actual Figures: The actual financial performances booked at the close of the period.
- Variance: If you subtract the actual number from the number that had been budgeted, you get the difference. These variances can be either favorable (charges that were less than planned) or unfavorable (charges that were greater than planned).
Why is It Good to Prepare a Budget Analysis and Examine Variances?
Budget vs Actuals is a must-have analysis for SaaS companies as it helps monitor critical metrics like revenue growth, customer acquisition costs, churn, and operating expenses. It helps companies:
- Identify Financial Trends: By comparing budgets to actual results regularly, businesses can identify trends that are not obvious on the surface. Then those can be presented to make it easy to take proactive actions.
- Control Costs: If the actual cost is higher than the budget, the SaaS company can cut some high-cost projects to control costs and avoid financial impact.
- Refine Financial Forecasting: Ongoing assessment and revision make future budgets increasingly precise, fostering more effective financial forecasting and resource allocation.
How to Analyze Budget vs. Actuals for a SaaS Company
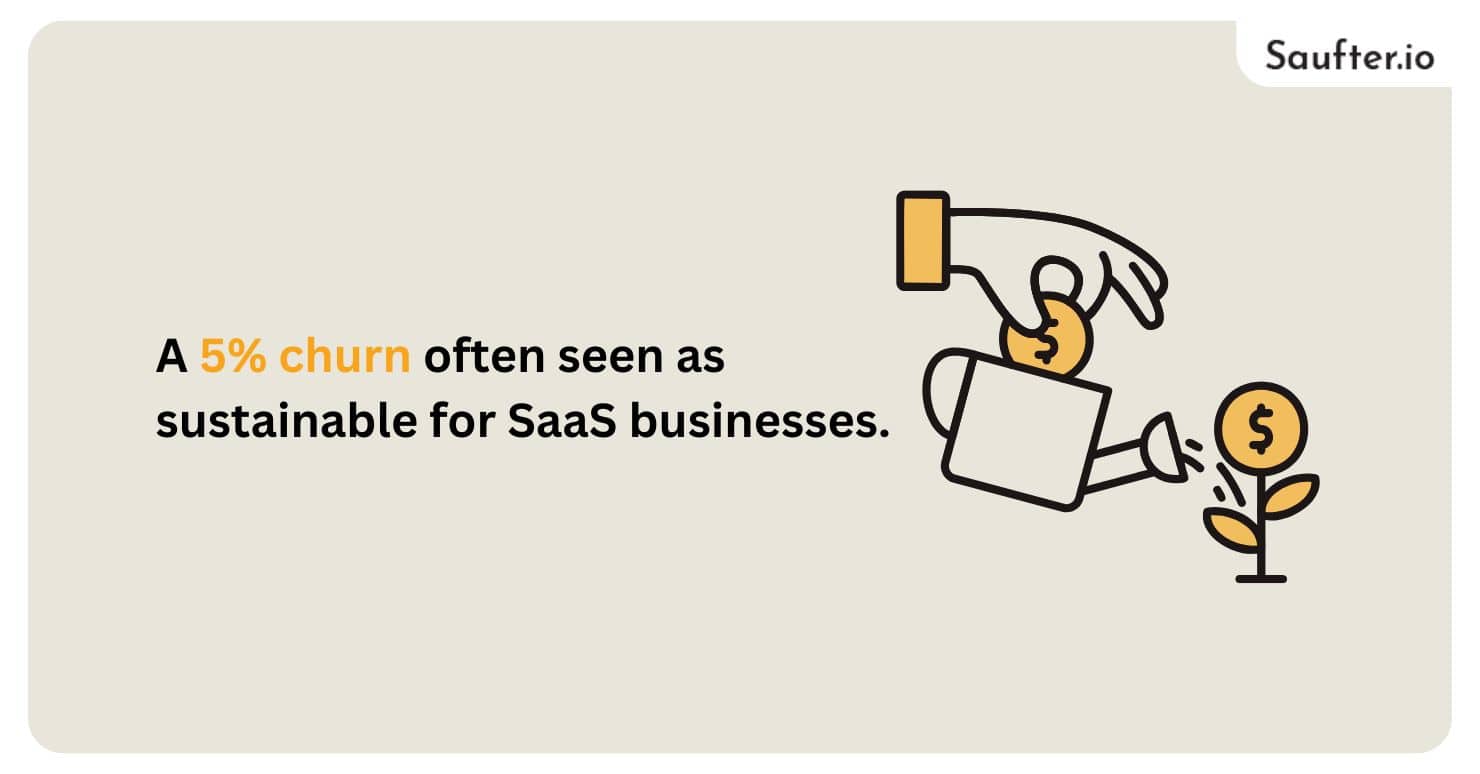
When analyzing the Budget vs. Actuals for a SaaS company, define the following key metrics Monthly Recurring Revenue (MRR), churn (A 5% churn often seen as sustainable for saas businesses). Also consider key operating expenses such as Sales & Marketing, R&D, and General & Administrative expenses. Collect the planned and actual figures, and categorize them to identify differences.

Revenues variances, for that matter, can provide insights into problems in customer acquisition, churn, and expansion. Cost of Goods Sold (COGS) and other variances point to unplanned expenses, like hosting or third-party services. Looking at operating expenses, similarly, can help identify if there is any over or under-spending in areas such as Sales & Marketing or R&D.
Profitability measures like gross profit, EBITDA, and cash flow are key indicators of the cash burn effect, which is a major issue with SaaS. Things like customer usage and engagement can also help explain financial variances.
Take this analysis to tailor your future forecasts and budgets, and fine-tune the assumptions or estimates on revenue and costs. Understandable reports and visualizations, including variance heatmaps and trend lines, communicate the results across the teams.
This process helps SaaS companies to maintain lower costs, increase revenue, and strategize to match better with the behaviors and products for improved performance and profitability.
Budget Vs Actual Analysis Example
Analyzing budget vs. actuals for a SaaS company involves comparing projected revenue, expenses, and other metrics to the actual results for a specific period, identifying discrepancies, and understanding their implications. Here’s a step-by-step guide with an example.
Step 1: Set Up Budgeted Figures
A SaaS company creates a budget at the start of the quarter, setting targets for revenue and expenses. For example:
- Revenue: $500,000
- Marketing Expenses: $100,000
- Customer Support Costs: $50,000
- R&D Expenses: $70,000
These budgeted figures represent the goals for the quarter.
Step 2: Collect Actual Figures
At the end of the quarter, the actual figures are gathered for comparison:
- Actual Revenue: $450,000
- Marketing Expenses: $120,000
- Customer Support Costs: $40,000
- R&D Expenses: $75,000
Step 3: Calculate Variances
The variance is the difference between the budgeted and actual figures. Here’s the calculation for each category:
| Metric | Budgeted | Actual | Variance | Type |
| Revenue | $500,000 | $450,000 | -$50,000 | Unfavorable |
| Marketing Expenses | $100,000 | $120,000 | +$20,000 | Unfavorable |
| Customer Support Costs | $50,000 | $40,000 | -$10,000 | Favorable |
| R&D Expenses | $70,000 | $75,000 | +$5,000 | Unfavorable |
- Revenue Variance: Revenue was $50,000 lower than budgeted, indicating a shortfall in expected sales or customer acquisition.
- Marketing Variance: Marketing spent $20,000 more than budgeted, possibly due to a higher cost of customer acquisition or increased ad spend.
- Customer Support Variance: Customer support costs were $10,000 below budget, a favorable variance indicating efficient support operations or lower demand on support resources.
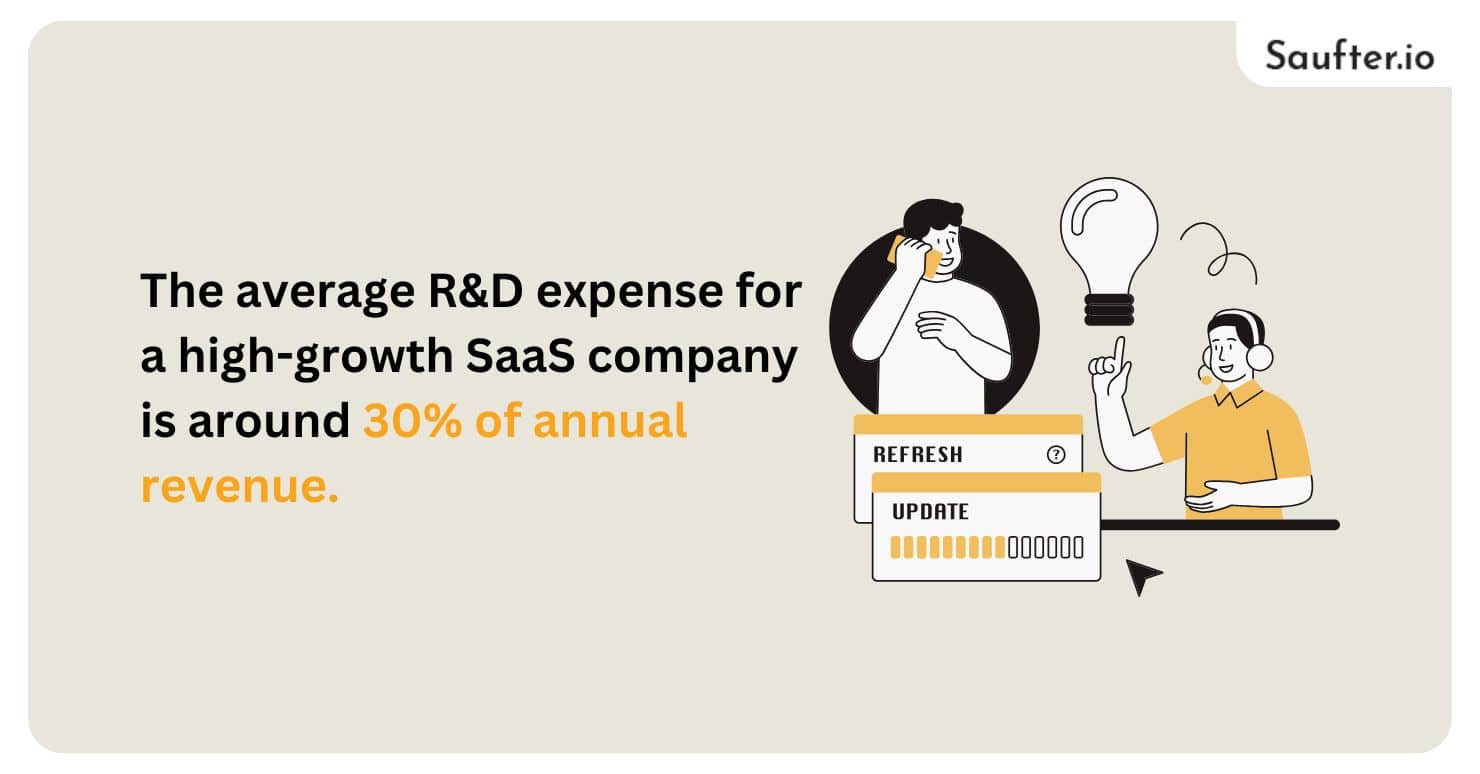
- R&D Variance: R&D costs exceeded the budget by $5,000, which may reflect additional resource allocation for new feature development. The average R&D expense for a high-growth SaaS company is around 30% of annual revenue.

Example Summary and Outcome
The SaaS company discovered that while customer support was operating efficiently, both revenue and marketing costs needed adjustment. With these insights, the company could reallocate resources and refine strategies to close the revenue gap and control marketing costs, ultimately improving overall profitability and aligning future budgets more accurately with actual needs.
Favorable and Unfavorable Variance
In a Budget vs. Actuals analysis, the actuals are then compared to the budget, and the resulting differences are called variances. Such variances can be classified as favorable or unfavorable, based on their effect on the business:
Favorable Variance
When actual performance is better than the budget. For example:
- Favorable Revenue Variance: Revenue was above budget because sales were higher, churn was lower, or customers upgraded more.
- Favorable Expense Variance: The actual expenses are less as compared to the budget, implying lower costs on operations, marketing, or hiring.
Unfavorable Variance
This is a situation, where the actual outcome is lower than the outcome included in the budget plan. This might suggest a problem or low performance. For example:
- Unfavorable Revenue Variance: Actual revenue is less than budget, which could be due to lower sales, higher churn, or fewer customer upgrades.
- Expense Unfavorable Variance: Your expenses are higher than the budgeted figures. You could have spent more on hosting, and third-party tools, or did over-marketing than planned.
Positive variances typically show that operations are running efficiently or that growth has outpaced plans. On the other hand, negative variances point out areas in which budgets or strategies may need to be adjusted.
Must Read: What is Your Business’s Burn Rate?
How to Use Variance Analysis to Drive Outcomes
In order to adequately assist management in having the big picture and the finer details, the company’s reporting system must be in place. With variance analysis, the team can identify critical areas to focus on; often, those areas with the biggest variances.
If your cost of revenue increases 20% against the budget but is in line with a 20% increase in annual recurring revenue (ARR), this proportional increase reflects a stable relationship without an area of immediate concern. On the other hand, if revenue grows by 5% and the sales and marketing costs increase by 50%, it is time to question whether something is wrong.
It also applies to non-financials, be it conversions, lead generation, or top-of-funnel activity. Before you can perform variance analysis, you need to define a number to measure against, be it a budget or a forecast.
After discrepancies are identified through variance analysis, action is needed, but that action may mean getting more information. If funnel metrics (traffic and PPC costs) start going up but monthly recurring revenue (MRR) is flat, then this could mean you are targeting the wrong people or your ad copy is not working.
You can test and refine a basis over weeks or even months to identify the culprit. The truth is without variance analysis to guide you, you may find it daunting to determine where to begin with these optimizations.
Saufter.io – The Best AI-Powered Customer Engagement Platform

Saufter is a platform offering AI chatbot solutions designed to enhance website engagement. It allows businesses to create customized, conversational bots that automate responses, streamline customer interactions, and improve user experience.
Saufter’s chatbots can be tailored to answer FAQs, assist with customer support, and gather user data efficiently. This makes it an effective tool for companies looking to elevate customer interaction without extensive manual involvement.
Conclusion
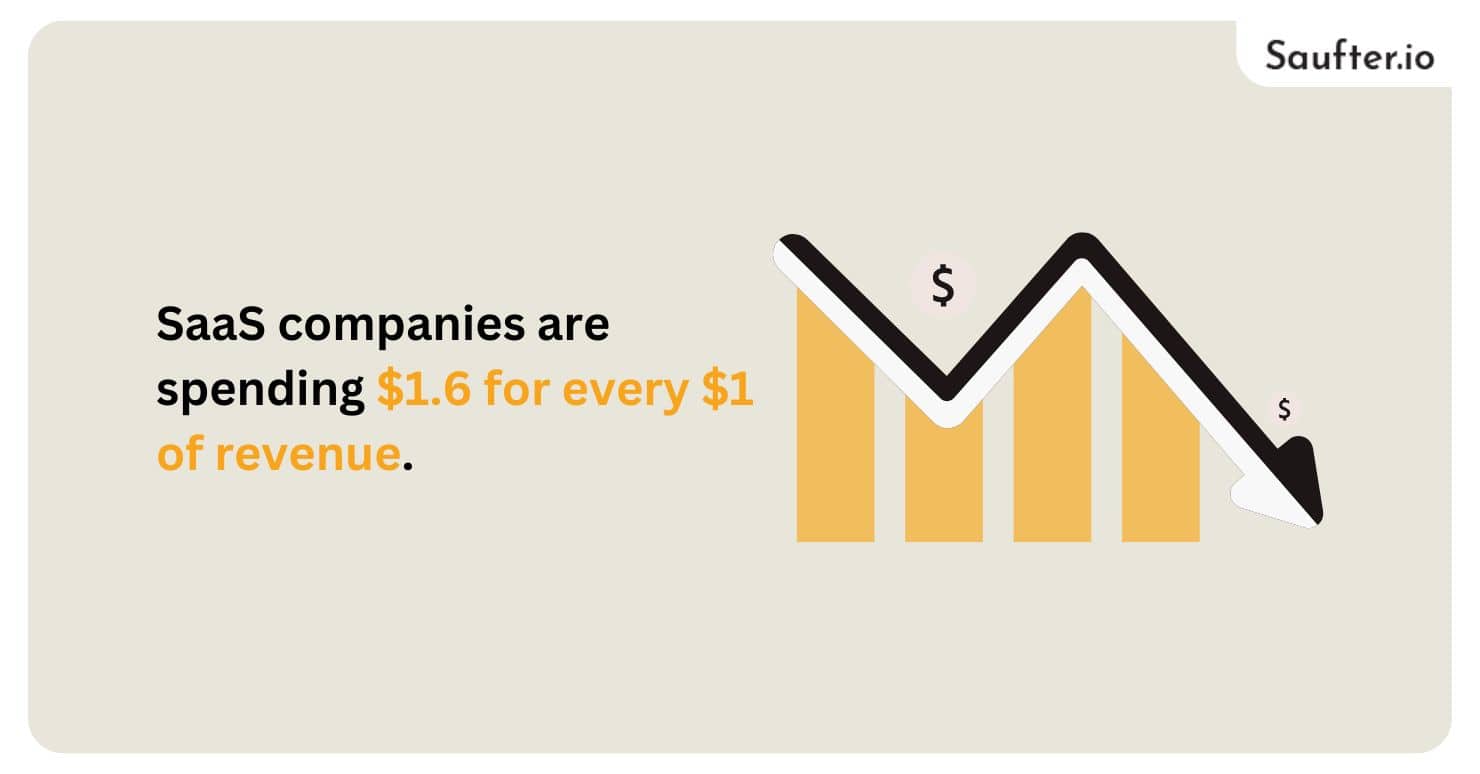
In conclusion, leveraging variance analysis to monitor “budget vs. actual analysis” performance can significantly impact SaaS success, while companies are spending $1.6 for every $1 of revenue. By identifying where actuals deviate from projections, SaaS leaders can optimize spending, focus on high-impact areas, and ensure alignment with growth targets.

Tools like Saufter, with its robust AI chatbot features, can support this process by automating customer interactions and data collection, adding valuable insights to the analysis. Embracing these strategies paves the way for smarter, data-driven growth in the SaaS industry.


