The time taken to respond to a customer’s query is quite crucial for a customer’s overall experience. In fact, according to a report from Comm1000, “71% of consumers (age 16 – 24) believe that a quick response from your service team can drastically improve their customer experience.”
If your response times are not fast, your customers might not feel good contacting you. A recent study found that 94% of the 2,000+ respondents “dread contacting customer support.” Additionally, 70% of customers prefer chatbots over phone calls or emails due to the simplicity of reaching out and getting an instant response.
To improve your average response time, you first need to measure it. While maintaining a good average response time could become a bit tough at times, the method to calculate response time is not that complex.
Today, we’ll tell you how to calculate response time and the different ways through which you can track it.
Contents of this post are as follows:
- What is the Average response time?
- Average response time formula
- Different ways to track response time
What is the Average response time?

Before diving into the process of response time calculation, let’s first understand what the terms “first response time” and “average response time” actually mean.
First response time is the amount of time taken to respond to a ticket from the time it was created over a particular period of time.
Average response time, on the other hand, is the average time taken by an agent to respond to his tickets over a certain period of time.
Why is calculating average response time important?
Measuring the level of something is considered the first step to improving it! The same is with the average response time. If you do not know if your response times are good or bad, you would be taking action blindly without a proper strategy.
Whereas, calculating response times will help you know where you are lacking.
Have a look at some stats that prove why good response time which contributes to great CX, is crucial:
- Around 62% of consumers worldwide have stopped doing business with a company or brand due to poor customer service experiences (long wait times).
- 50 percent of buyers choose the vendor that’s the “first to respond to them.”
- Almost 90 percent of modern customers expect companies to offer a self-service customer support portal.
- 97% of global customers say customer service is either very important or somewhat important in their choice of and loyalty to a brand.
- 50% of the brands say they are planning to increase CX-related technology spending.
Now, let’s have a look at the response time calculator formula.
Average response time formula
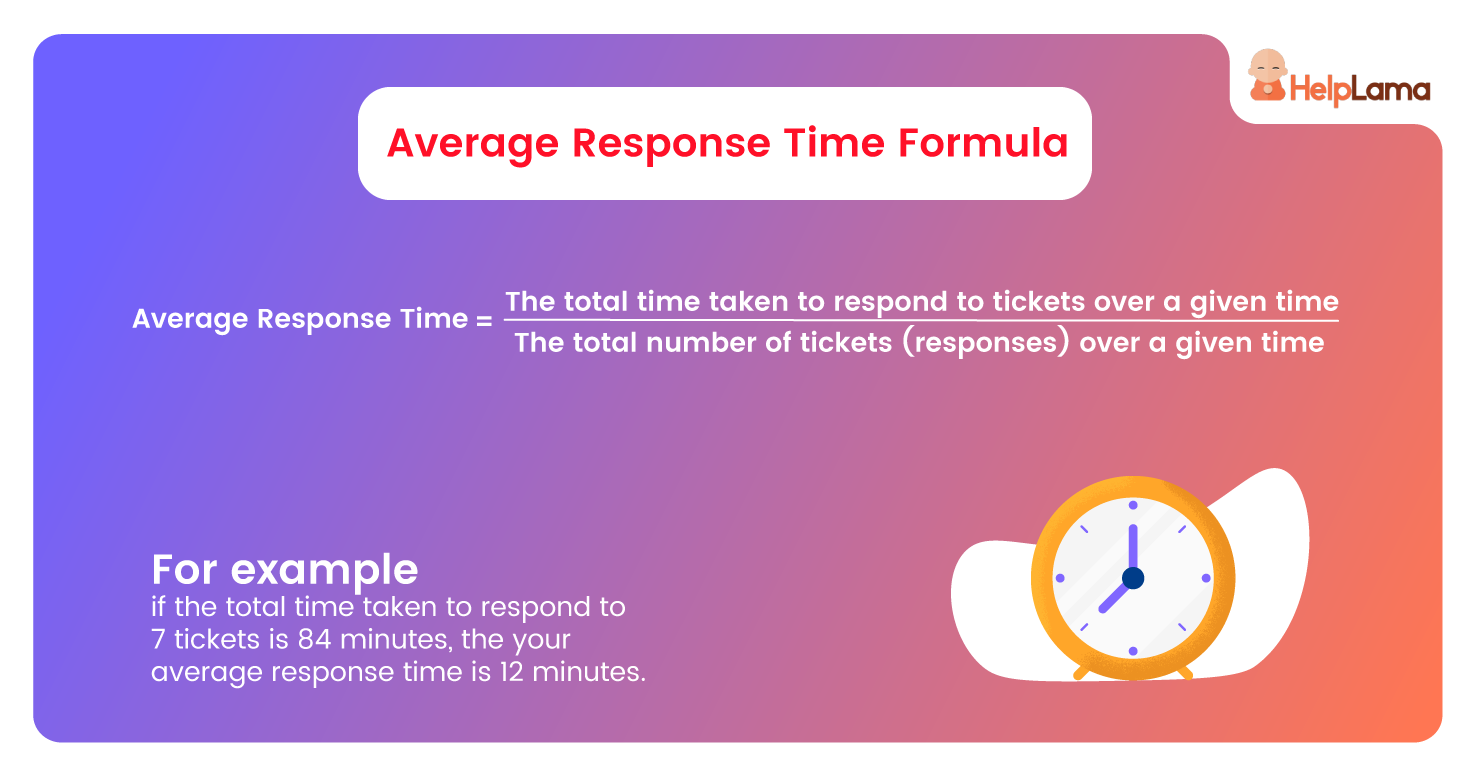
Average Response Time = The total time taken to respond to tickets over a given time, divided by the total number of tickets (responses) over a given time.
For example, if we have to calculate the average response time for the last 7 tickets, we’ll take the individual time taken by the agent to respond to each of these 7 tickets.
Here, total individual time taken for each ticket= 10 minutes, 8 minutes, 30 minutes, 15 minutes, 7 minutes, 8 minutes, 6 minutes
Total number of tickets = 7
Total time taken = 84 minutes
Average Response time = 10+8+30+15+7+8+6 (in minutes) divided by 7 = 12 minutes
Different ways to track response time:
Now that we know how to measure response time, let’s have a quick look at some of the ways through which you can track your response time:
1. By analyzing responses from every channel
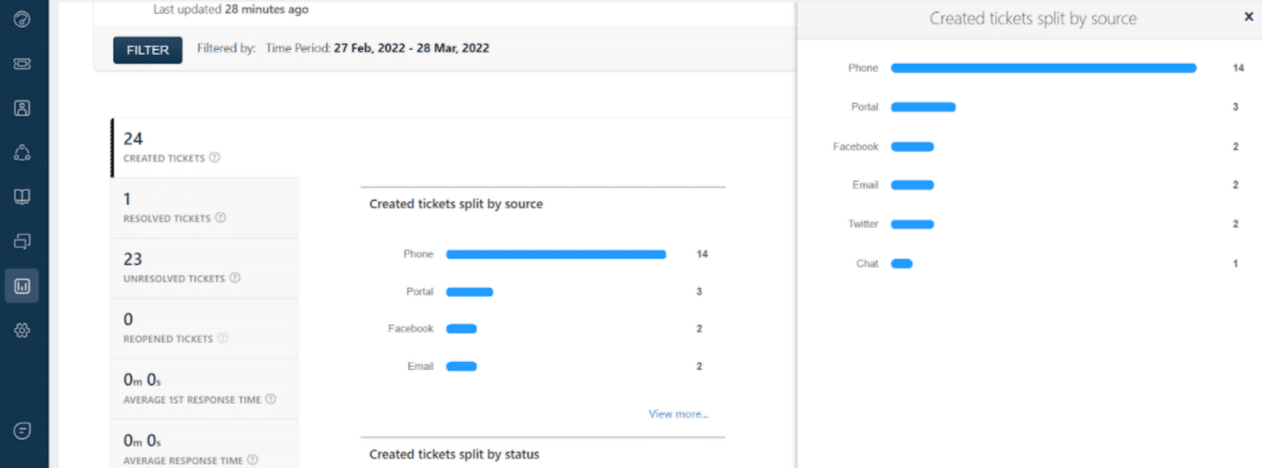
One of the many qualities of a good helpdesk is its omnichannel service. You can track your interactions with your customers across all channels from a single place.
In some helpdesks like Zendesk and Freshdesk, the comments and mentions you receive on your social media platforms get directly converted into tickets. It helps you improve your response time significantly, as you don’t have to waste your time switching tabs.
2. By analyzing ticketing status
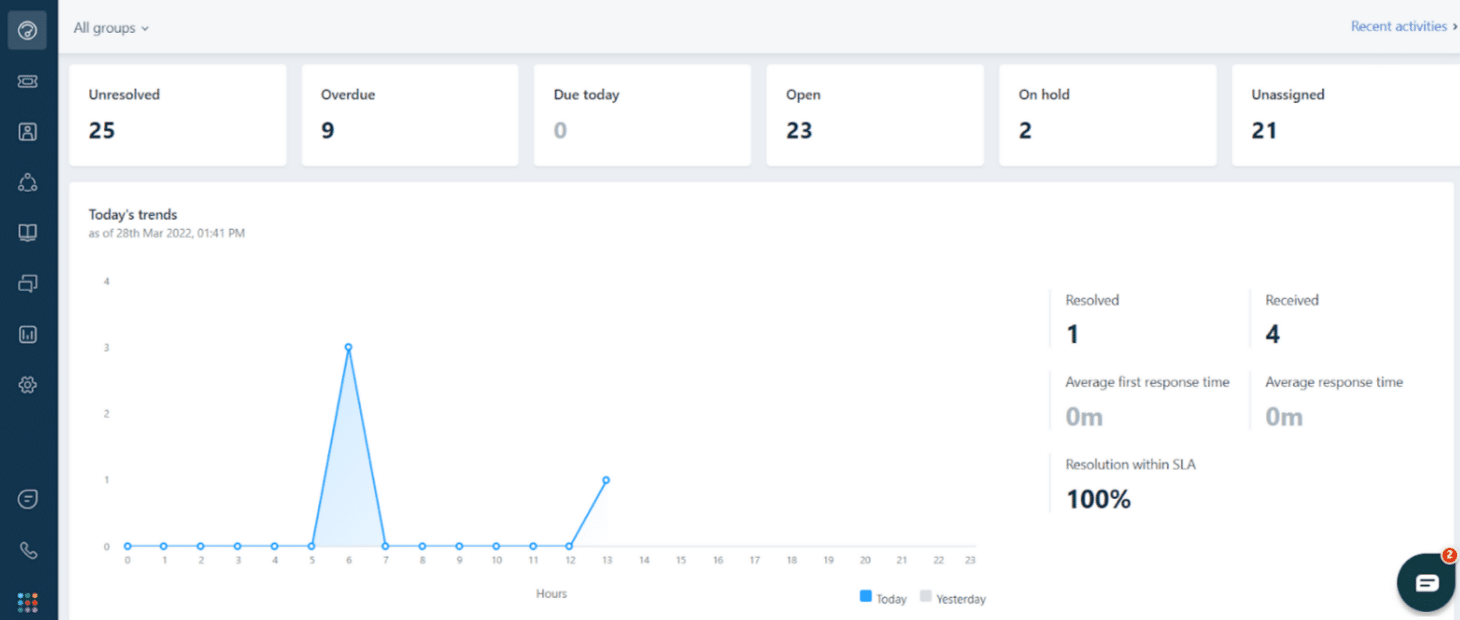
The reporting that a helpdesk offers, is yet another efficient way to keep a track of your response time. Usually, helpdesks offer reports for agents through an overview tab or an agent productivity dashboard.
In the dashboard, the agent can view the status of the tickets (unresolved, overdue, open, on hold, unassigned). It helps the agent track his own performance and the amount of time it took to resolve a ticket.
3. By viewing responses on the basis of priority
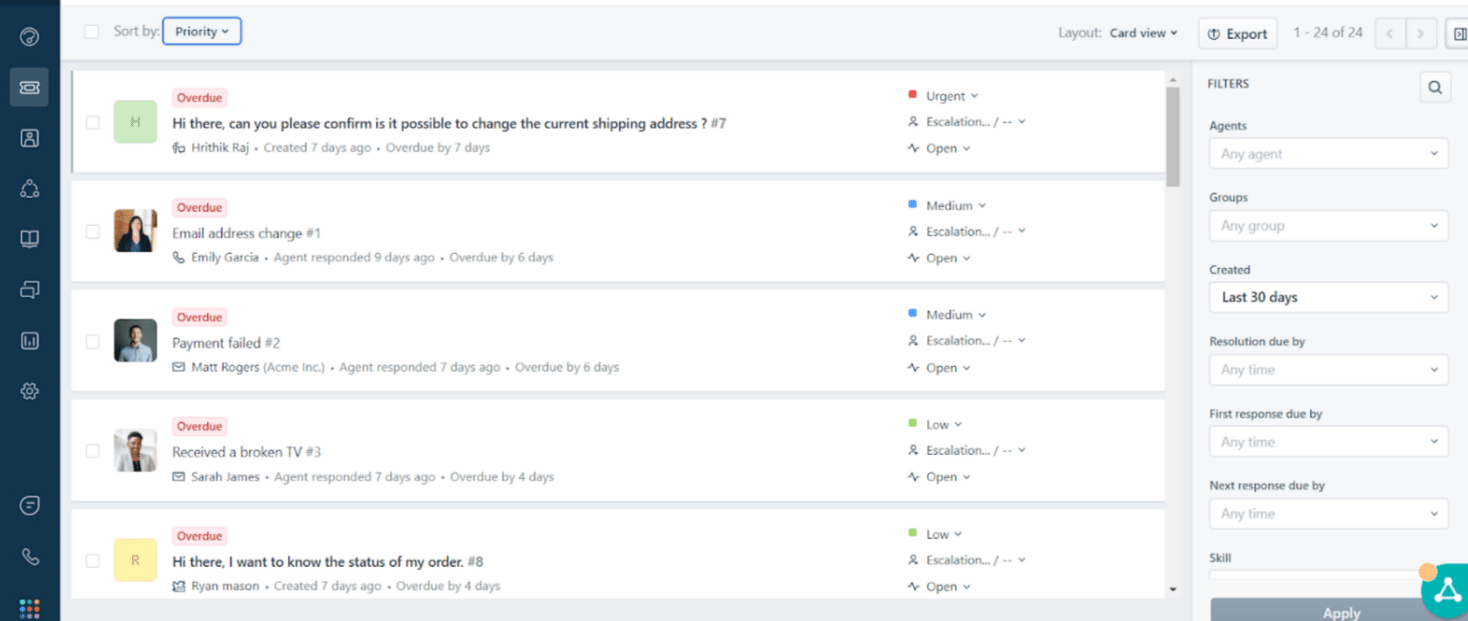
Not tending to an urgent or high-priority ticket on a timely basis can lead to customers churning out of your company. This is where helpdesks provide the option to categorize tickets on a priority basis.
It helps the agent identify the high-priority tickets with the low-priority ones. Also, this helps the agent keep track of the responses categorically.
4. By setting custom filters
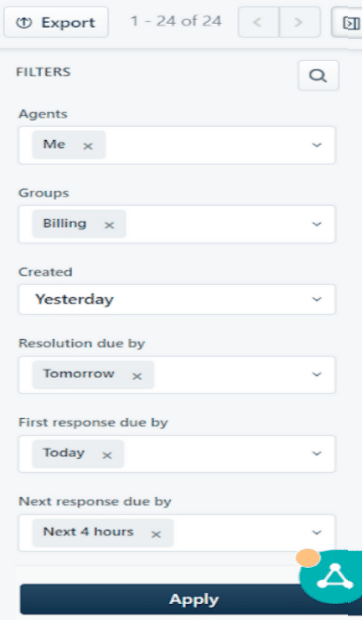
It is one of the most simple ways to track your average response time. In it, you just need to go to your reporting overview or agent productivity tab of your helpdesk and set desired values to certain parameters in the ‘filters’ section of your tab.
It helps you analyze your response time for any specific period of time and gives you the data to monitor your performance during that particular period.
Conclusion
Tracking your performance with the help of the average response time formula can help you monitor and improve your overall agent performance significantly.
Additionally, be digital-first and adapt to technology and AI. According to a review by Adobe, digital-first companies are much better at customer experience. As a result, they are 64% more likely to overperform their business goals.
But still, reducing your customer’s response time after they have raised a query is no easy feat!
Nevertheless, you can certainly improve your average response time by outsourcing customer service to a specialized third-party company like Helplama.
Our zero-risk model will ensure you high-quality risk-free services starting from just $399/month.


